Developing Amazon Recommendations

By Harrison Li, Thomas Jiang, Masahiro Kusunoki, Daniel Chen

CS 109a Fall 2016

The Amazon Fine Foods Dataset, collected and distributed by the Stanford Network Analysis Project, contains nearly 600,000 Amazon reviews of over 70,000 food and food-related products by over 250,000 users. With this data, we set out to develop a system for predicting future ratings based on a combination of product features and user characteristics. If successful, such a system could be used as an accurate recommendation system.

Data Sources:

Our data set consists of 568,454 reviews on 74,258 food-related Amazon products by 217468 users. Each review includes UserId, ProductId, Score, and Text, as well as some other values.

In order to obtain meaningful features for the products in the data set, we took advantage of the Amazon API. This API allowed us to look up items by the ProductIds and return Product Groups. For example, product B003XUL27E, named Healthy Choice All Natural Red Beans & Rice, 14-Ounce Containers (Pack of 6), returns product group Grocery.

Click the right arrow to see a full list of features and their explanations.

Datasets

Amazon Fine Foods Dataset

Id Unique number assigned to each review
ProductId Unique identifier for the product
UserId Unique identifier for the user
ProfileName User name corresponding to the UserId
HelpfulnessNumerator Number of users who rated the review as helpful
HelpfulnessDenominator Number of users who indicated whether they found the review helpful
Score Rating between 1 and 5
Time Timestamp for the review
Summary Summary of review, written by user
Text full review text

Amazon API

Product ID Input provided from Amazon Fine Food Dataset
Product Group Categorization of product defined by Amazon

Data Exploration

As with any real world dataset, the Amazon Fine Foods Dataset contained many peculiarities. We present six of the most interesting observations: Duplicates, Sparsity by User, Sparsity by Product, Rarity of Helpfulness Scores, Disproportional Score Distributions, and Time Drifts. We corrected for the first four observations during our modeling. Though the remaining two did not inform our model, we present them as curiosities that would be interesting to explore in future work.

Click the right arrow to see individual observations from our exploration.

1. Duplicates

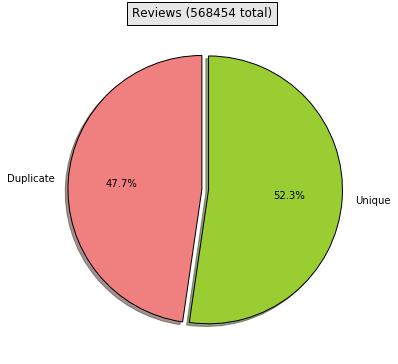
While exploring reviews, we found that several reviews had identical text, scores, user IDs, and timestamps on similar products. This does not seem to suggest a human user, and we hypothesize that these reviewers were left by bots. Including these bots would improve our RMSE (as bots are extremely easy to predict since they continually give identical scores), but for the sake of applicability to human users, we decided to filter out all such reviews, eliminating almost half of all reviews.

2. Number of Reviews by Reviewer

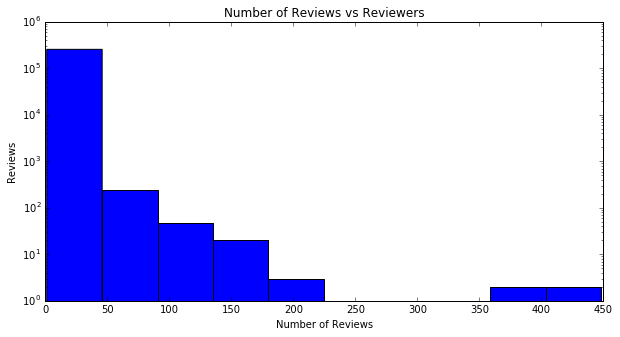
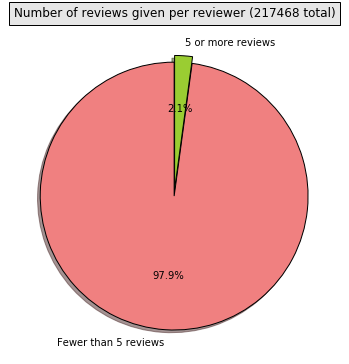
This compares the number of active users, which we define to be users with 5 or more ratings, to the number of inactive users. Inactive users do not have enough ratings for us to accurately judge their product preferences, and therefore our model also removes them when training on our dataset.

3. Number of Reviews by Product

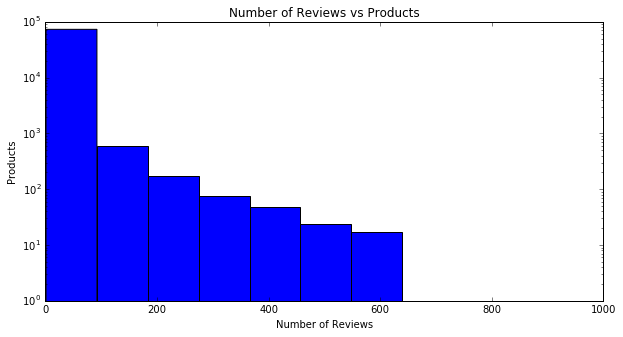
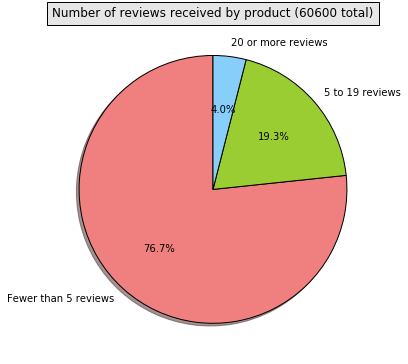
Compounding the sparsity of user ratings, each product also generally has very few ratings. With so few reviews, it's difficult to accurately judge product similarity using just the Fine Food Dataset, motivating us to use the Amazon API to provide additional product features.

4. Helpfulness Skew

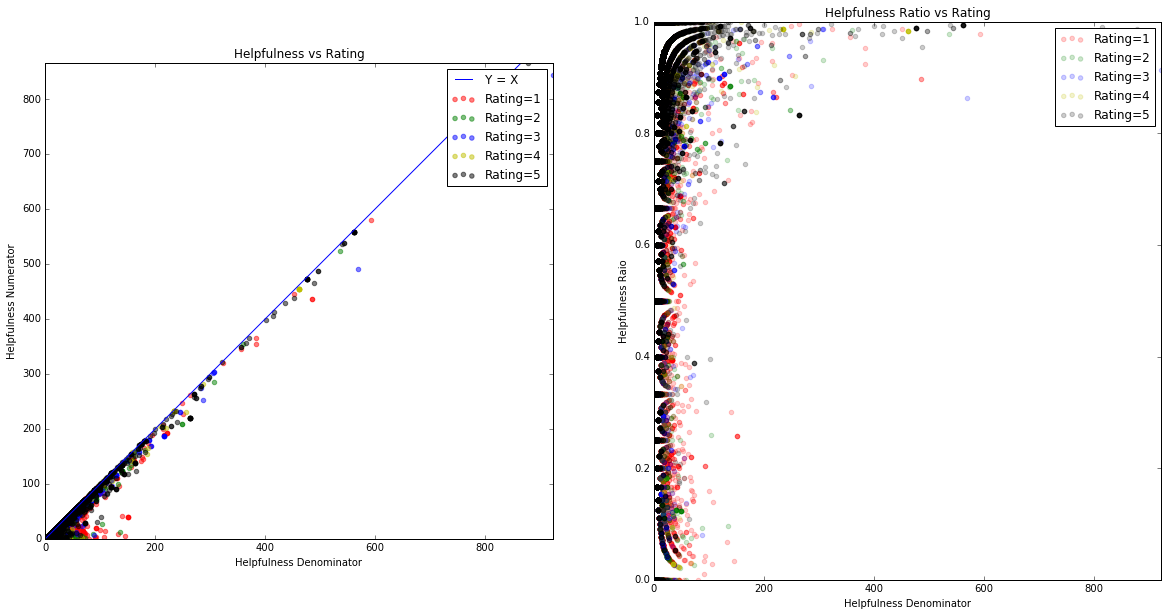
The data provides both helpfulness numerator and denominator. The ratio of the two gives the percent of readers who find each review to be helpful. It's clear that once again, most reviews have very few helpfulness ratings. A rating of 1 out of 1 or 0 out of 1 is not dramatically significant, so when using helpfulness as a proxy for estimating review quality, we assigned a 1, 1 beta prior.

5. Score Skew

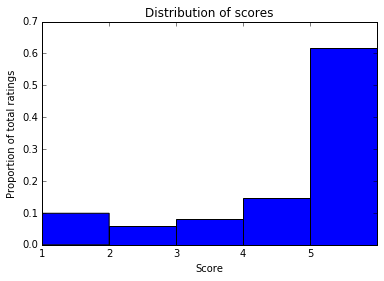
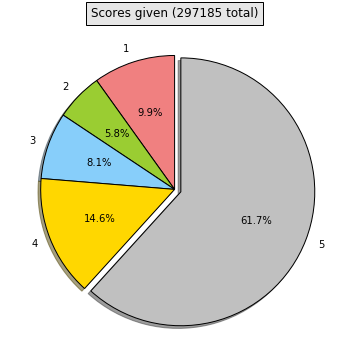
Interestingly, a large majority (63.9%) of the ratings given by users across all products are 5 out of 5, while negative ratings (defined as 3 stars or less) constitute only 22% of all ratings. We did not correct for this phenomenon since we treat the scores as quantitative values instead of categorical, but it is reflected by predicted values also yielding a high average.

6. Time Drift

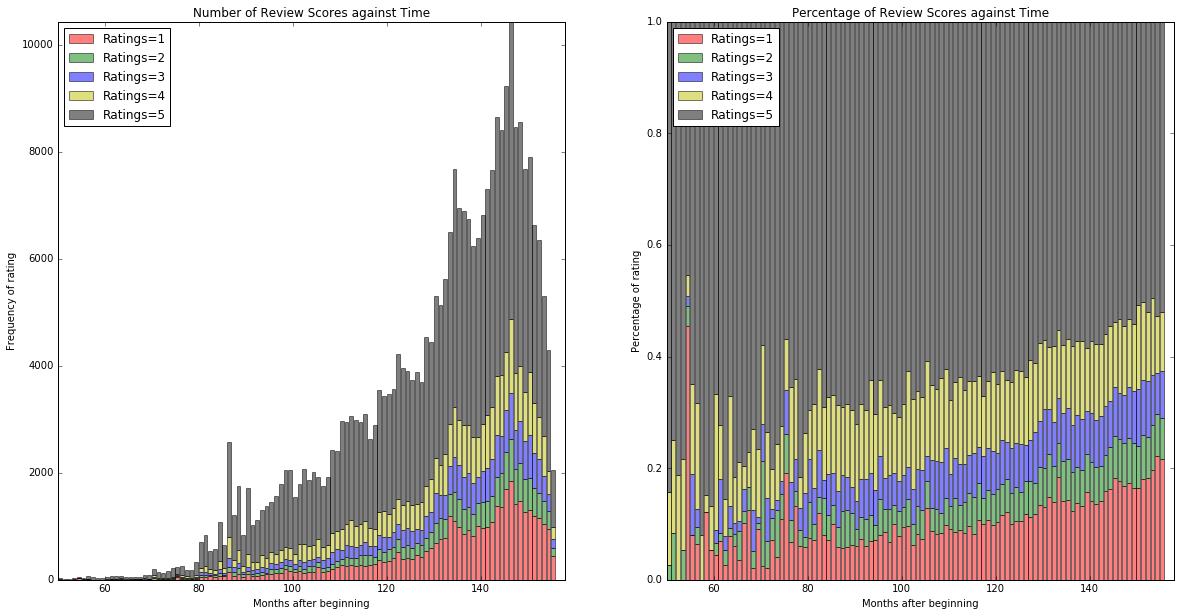
Scores seem to improve over time throughout the dataset. We do not yet have a robust explanation of this phenomenon, but it could potentially be accounted for by a more complex model.

Modeling

We developed our final model in three steps. First, we created two baseline models to serve as our target to beat. Then, we developed a model for determining a product's "true" score based on previous reviews by other users. Finally, we developed a method for calculating product similarity by review text, which we were then able to use to estimate user preferences.

For modeling, the dataset, after all corrections discussed in the previous section, was split into a 70% training set and 30% testing set.

Click the right arrow to see how we developed our final model.

Baseline Models

We developed two baseline models, derived from a simple assumption. Our baseline models assume users will vote according to their past average. Thus, both of our baseline models simply predict future ratings by assigning them the mean or median of the user's past reviews.

Model RMSE
User Median Model 1.289
User Mean Model 1.198

Improvement

Our final content-based model was a combination of a product-based component and a user-based component, with the relative weightings of the two components controlled by the parameter β.

The product-based component will judge the general quality of each product, with the assumption that in general, people prefer objectively higher quality products to generally poor quality products, even if they don't have a specific preference for the item's features. To achieve this evaluation, we used a weighted average of all the scores of each item, where the assigned weight of each review was based on the helpfulness of the review (assigned using an uninformative uniform prior).

The user-based component assumes that users will prefer products that are similar to other products that they've both purchased and rated well. Judging product similarity was a nontrivial task. Because our dataset had minimal information on the specific products, we decided to combine two methods to generate product similarity. First, for each product, we aggregated all of its text reviews and vectorized it using a TF-IDF vectorizer (which converts text in a document to a vector of word counts weighted inversely by the overall frequency of words across all documents) and obtained its cosine similarity with all other products. Then, we used the Amazon API to extract product groups. Products that were in the same product groups had their similarity inflated by a tunable variable α.

To see a more mathematically rigorous explanation, please click the right arrow.

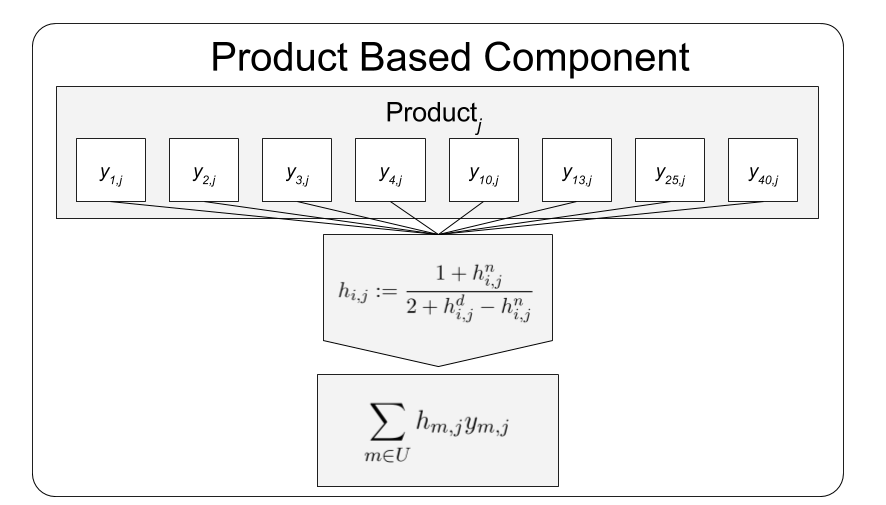
The product-based component is a weighted average of all ratings of that product in the training set, where each rating is weighed by the estimated proportion of users who rated user i’s rating on product j as helpful. This expression is derived from placing an uninformative Uniform (i.e. Beta(1,1)) prior on the helpfulness and taking the posterior mean (PM) estimate after updating the prior with the helpfulness numerator and denominator.

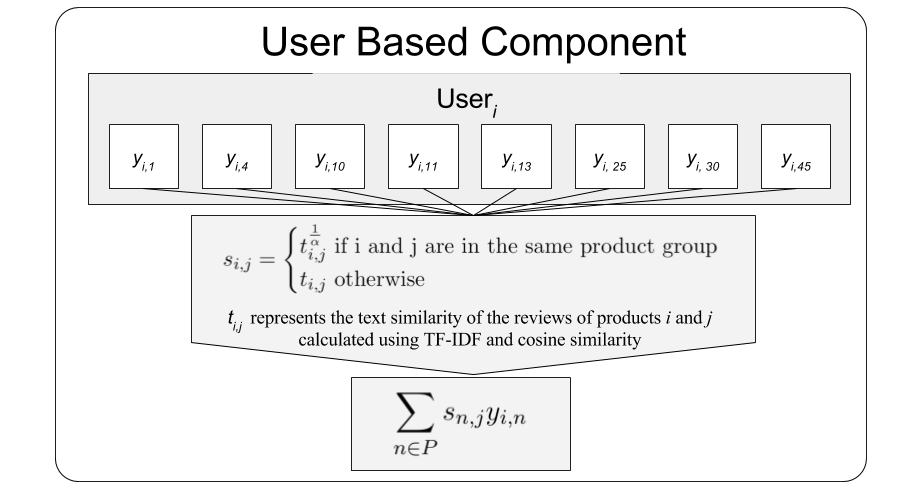
The user-based component is a weighted average of all of the ratings given by a particular user, where a similarity score between 0 and 1 for products n and j, represents the text similarity of the aggregated reviews of products n and j calculated using a TF-IDF vectorizer and cosine similarity. Due to computational limitations we only computed similarity scores for the 10,000 most reviewed products in the training set.

Product group is a categorical designation assigned by Amazon to each product (e.g. “grocery”, “pet foods”). The parameter α controls how much the similarity score for products in the same product group is inflated towards 1. Note that if α = 1, then product similarity reduces to text similarity in all cases.

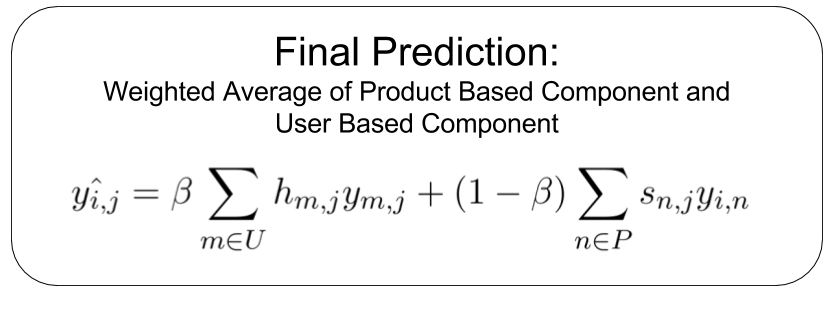
Our final model is the sum of the product-based and user-based components with relative weights assigned.

Results

We take the final model developed above, and tune the weighting parameters (α and β) to find our optimal model. We use KFold Validation on the original training dataset, we compute and plot RMSE scores to understand the impacts of the different weights. We then apply our optimal model onto the testing dataset.

Click the right arrow to see our tuning process and final results.

Tuning

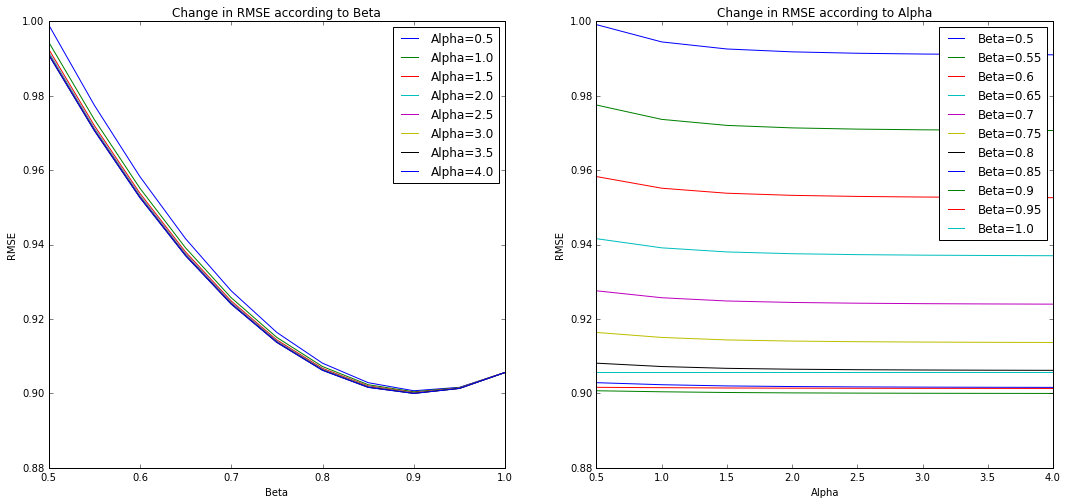
We tune the α and β parameters of the model by using KFold Validation (K=5). Plotting the RMSE scores, we see that this is more sensitive to changes in β, while α seems to have a small effect. We choose the optimal scores with α = 1 and β = 0.9

Improvement over Baseline

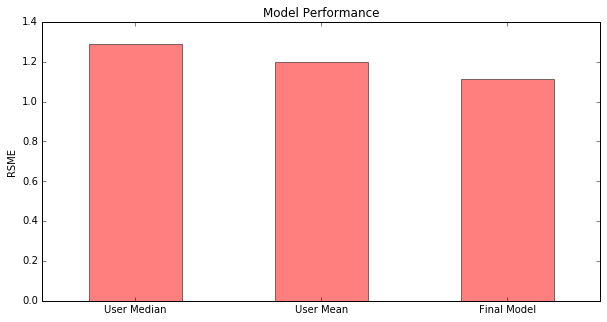
As shown above, our final model manages to beat both of our baseline models by customizing our predictions based on a combination of user preferences for each product, as well as the inherent quality of the products being reviewed.

Conclusions

We were successfully able to beat our baseline models. However, the final tuning of our model raises several questions that should be addressed in the future. For example, the selection of α = 1 indicates that product groups do not contribute meaningfully to our model. This may has two possible explanations. The first is that several of the Product IDs were no longer recognized recognized by the Amazon API, which suggests that these products are no longer being sold. This makes sense given that the dataset contains reviews from Oct 1999 - Oct 2012. The second is that the product groups do not represent an accurate method for categorizing products. Manually checking these values supports this. For example, when examining coconut oils from different brands, one was grouped under Groceries while the other was under Health and Beauty.

Click the right arrow to see our suggestions for future work.

Future Work

Though we beat our baseline models, our model only performs marginally better than a raw weighting of product mean and user mean. It appears that the similarity matrix was not an effective tool in our model. Furthermore, it suggests that user preferences, as far as we can tell, are not as individual as we believed, simply determining the benchmark the user reviews based on.

Furthermore, due to computational limitations, we were limited in the amount of products and reviews that we could predict on. Given the funding and computation time, it might be worth rerunning the entire computation process on the complete dataset.

Additionally, more features on users and products would give more information to train the model's components. This may be difficult given that Amazon’s API does not have an easy feature generation process for items and finding individual users and collecting more reviews is difficult due to privacy concerns. However, doing so may increase the amount of data to train on as well as improve the similarity matrix calculation process.

Finally, in our model, we currently disregard the timestamps of reviews. As shown in the Data Exploration section, we noticed a time drift in scores, but it is unclear what sort of predictive power or interpretation this feature would have in a more complicated final model, but it may be useful in normalize user ratings over time when calculating the product based components.

Click the right arrow to see our references.

References

Das, S. (2015, August 11). Beginners Guide to learn about Content Based Recommender Engines. Retrieved December 08, 2016, from https://www.analyticsvidhya.com/blog/2015/08/beginners-guide-learn-content-based-recommender-systems

Koren, Y. (2009). The bellkor solution to the netflix grand prize. Netflix prize documentation, 81, 1-10.

Leskovec, J., Rajaraman, A., & Ullman, J. D. (2014). Mining of massive datasets / Jure Leskovec, Standford University, Anand Rajaraman, Milliways Labs, Jeffrey David Ullman, Standford University (2nd ed.). Cambridge: Cambridge University Press.

Marafi, S. (2015, April 28). Collaborative Filtering with Python. Retrieved December 08, 2016, from http://www.salemmarafi.com/code/collaborative-filtering-with-python/